A wellness headline is useful only when you know what was measured. Before changing your routine or sharing a statistic, ask who was studied, when the data were collected and whether the number describes a habit, an opinion or a treatment outcome.
This reference brings together primary-source findings on weight management, nutrition, movement, sleep, stress, brain health and peptide research. Reporting periods vary and remain attached to each source. National surveys, global polls and clinical trials answer different questions; their percentages are not interchangeable.
Good Vita provides nonmedical wellness education and coaching. This page supports informed questions, not diagnosis, prescribing or treatment selection. Sources checked November 4, 2026.
Key Takeaways
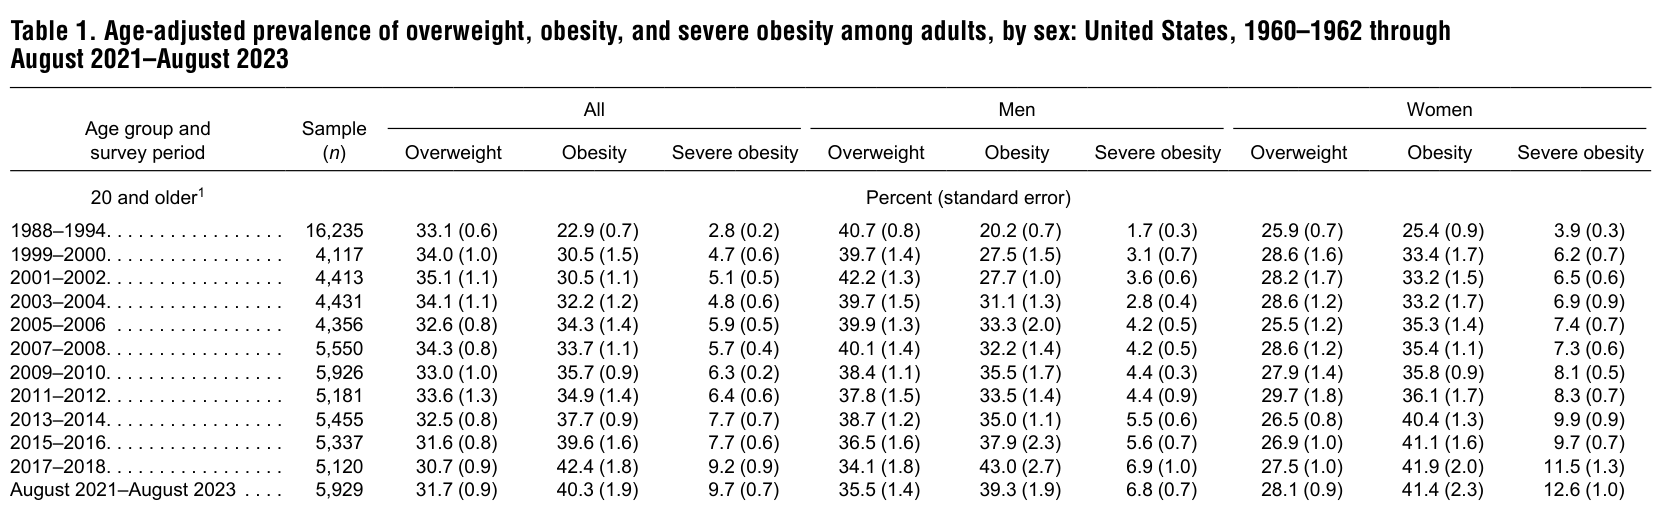
- Age-adjusted obesity prevalence was 40.3% among U.S. adults age 20+ in August 2021–August 2023. (CDC/NCHS, February 2026)
- Age-adjusted overweight prevalence, excluding obesity, was 31.7% in that same U.S. adult population and period. (CDC/NCHS, February 2026)
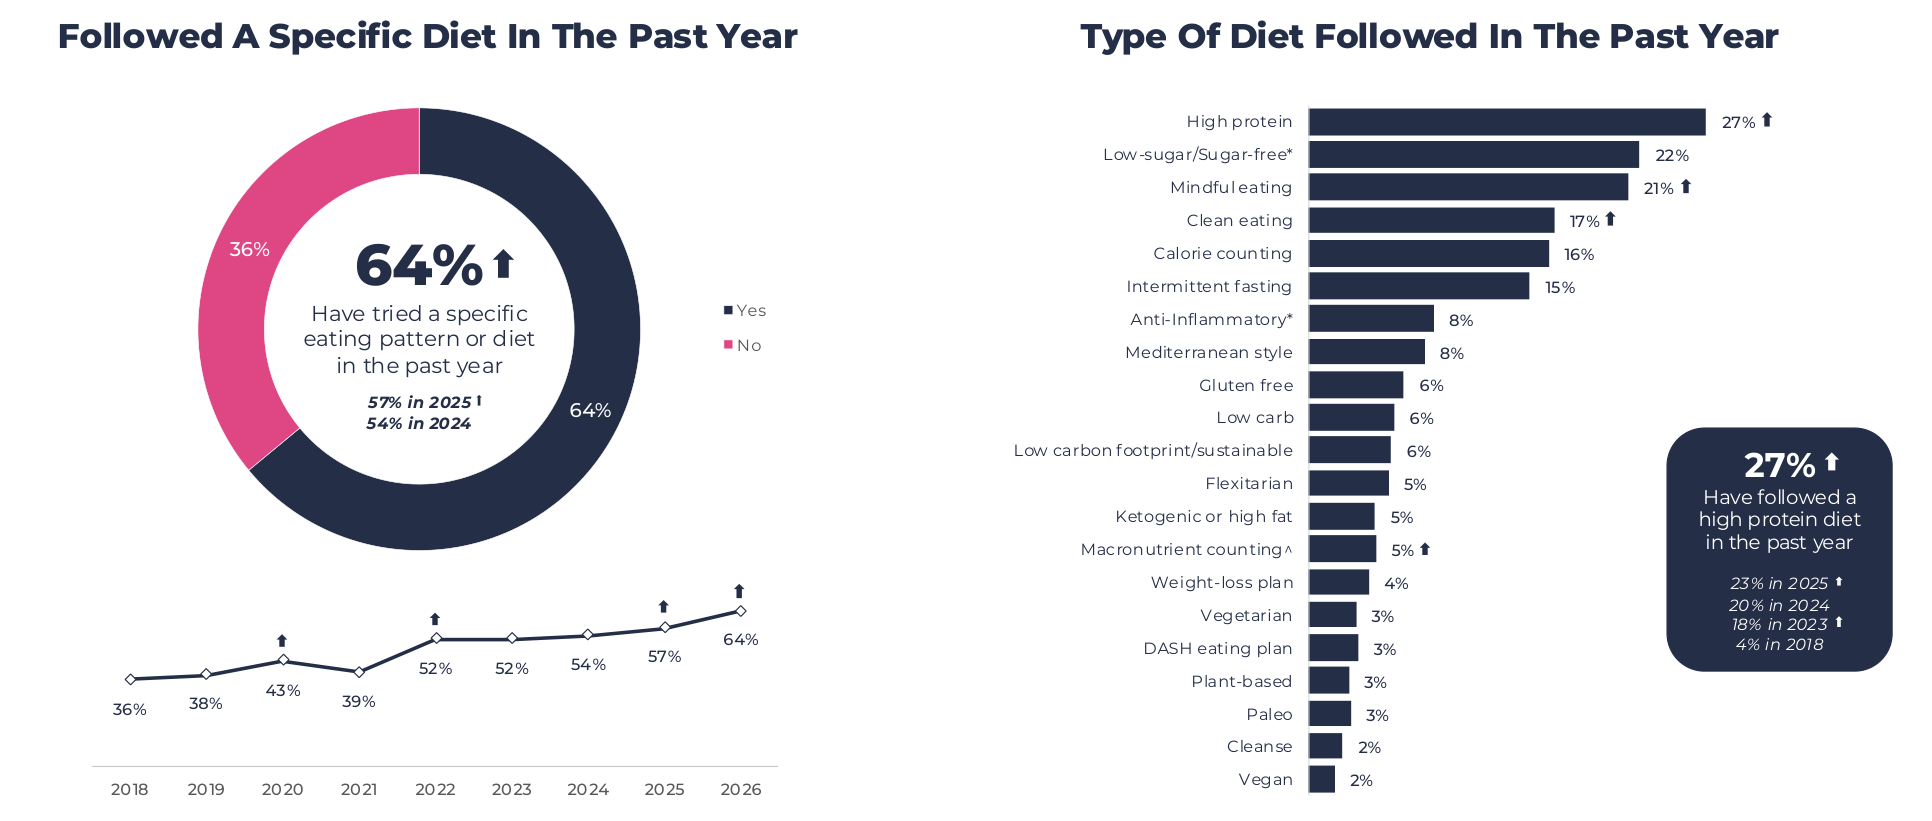
- 64% of U.S. adults surveyed by IFIC in 2026 reported a specific eating pattern or diet in the past year. (International Food Information Council, October 2026)
- 70% of IFIC’s U.S. respondents said they generally tried to consume protein in 2026. (International Food Information Council, October 2026)
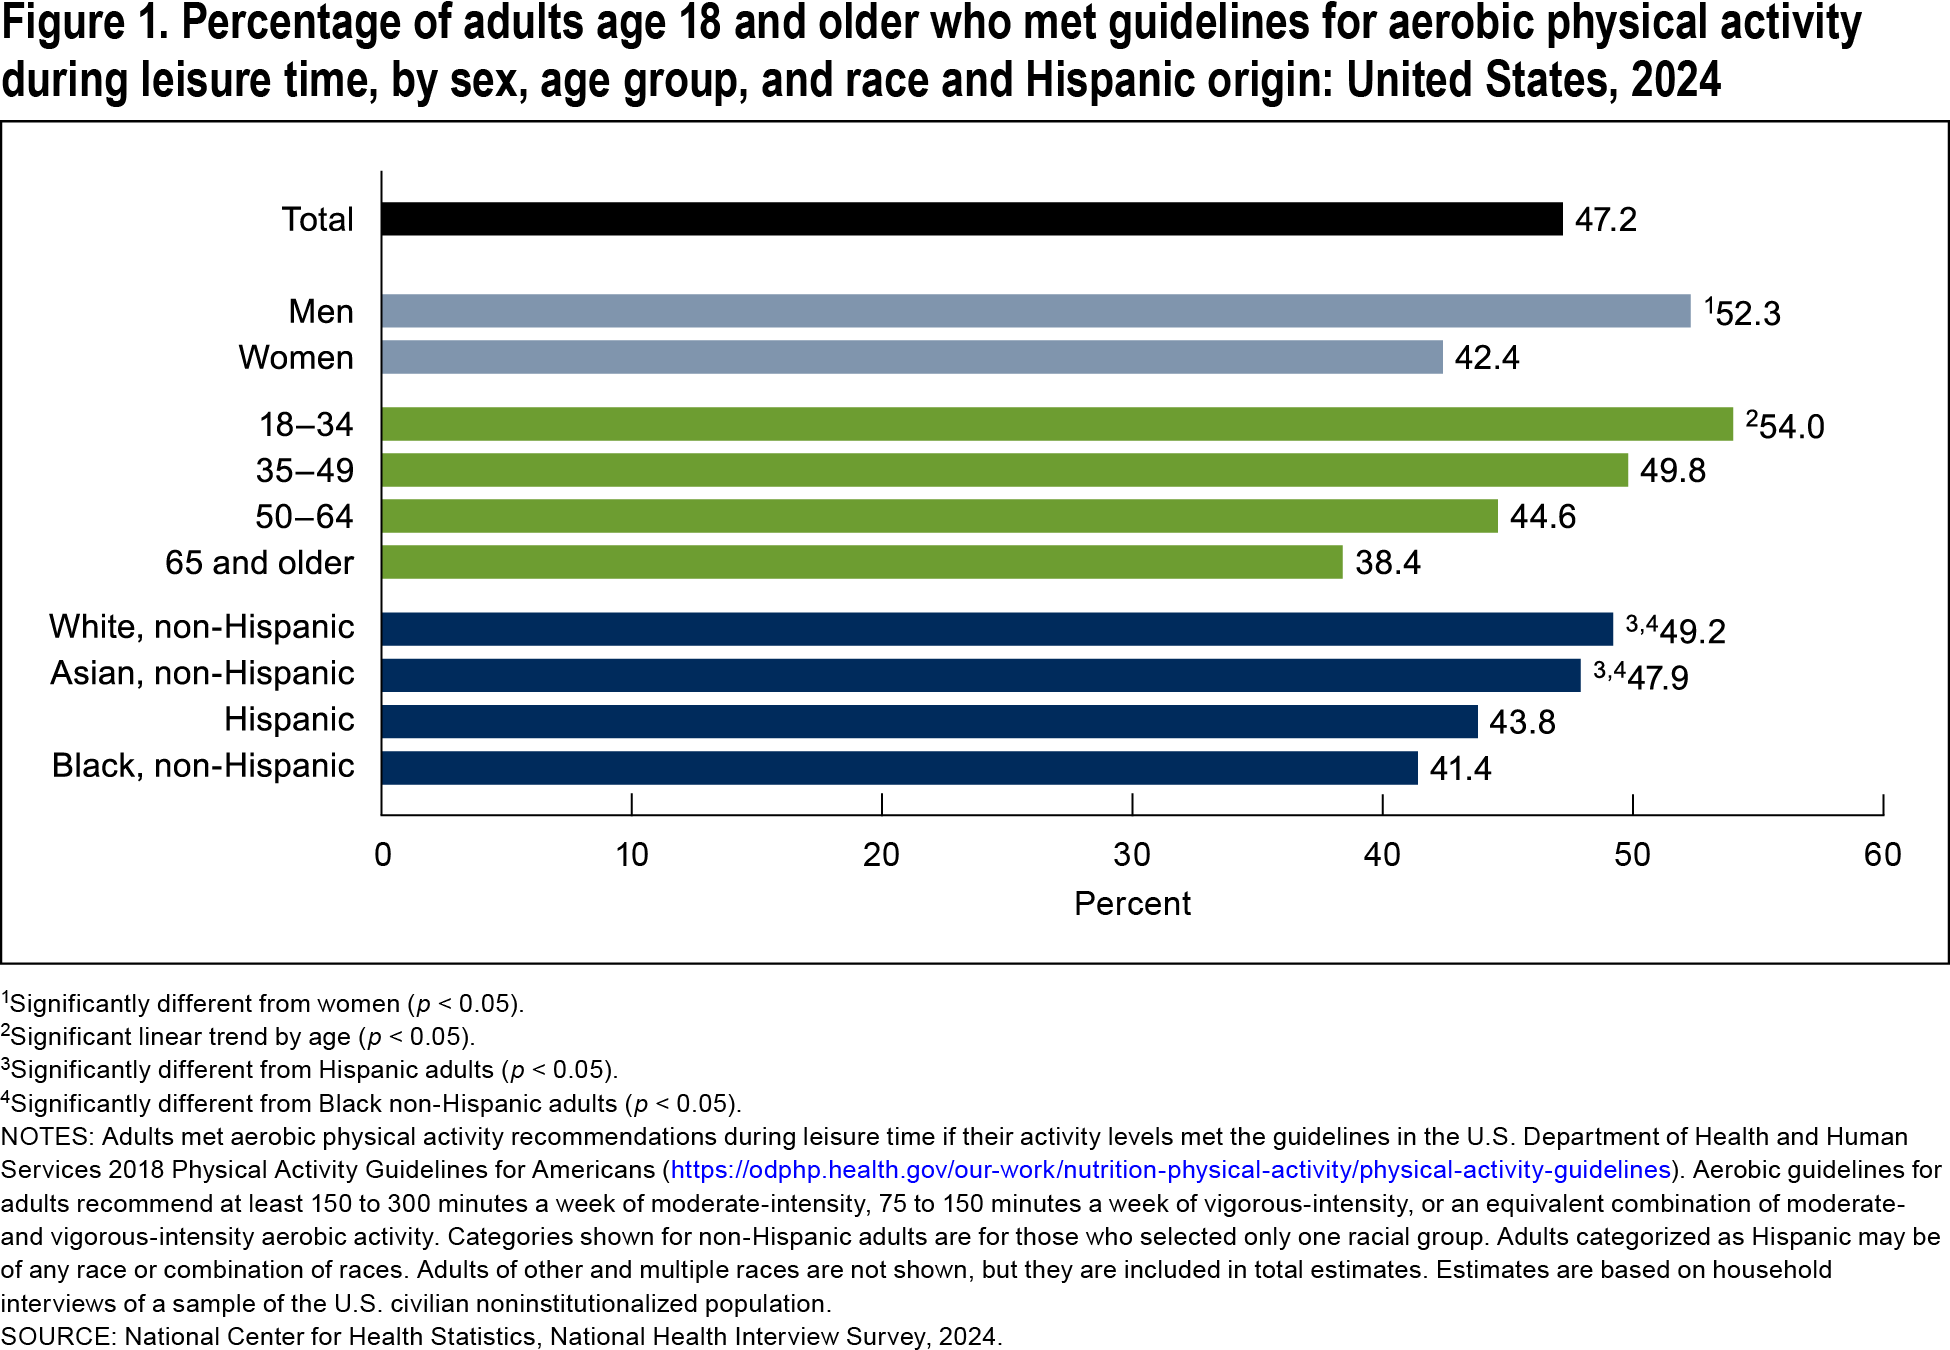
- 47.2% of U.S. adults met leisure-time aerobic guidelines in 2024. (CDC/NCHS, April 2026)
- Among U.S. adults age 65+, 38.4% met that aerobic measure in 2024. (CDC/NCHS, April 2026)
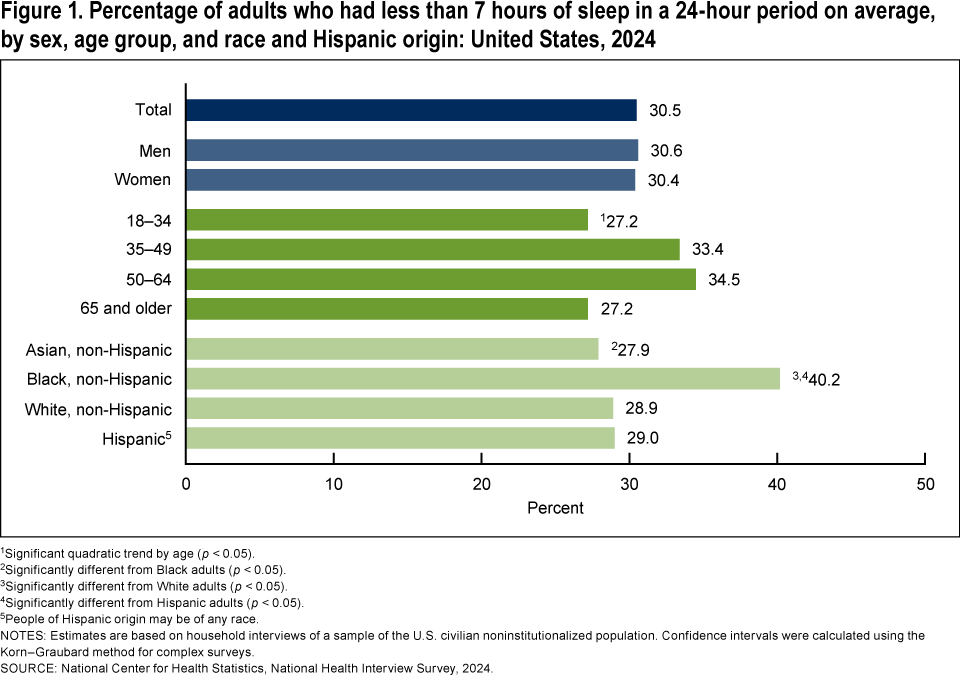
- 30.5% of U.S. adults reported short sleep in 2024: an average below seven hours per 24-hour period. (CDC/NCHS, April 2026)
- 54.8% of U.S. adults woke well-rested most days or every day in 2024. (CDC/NCHS, April 2026)
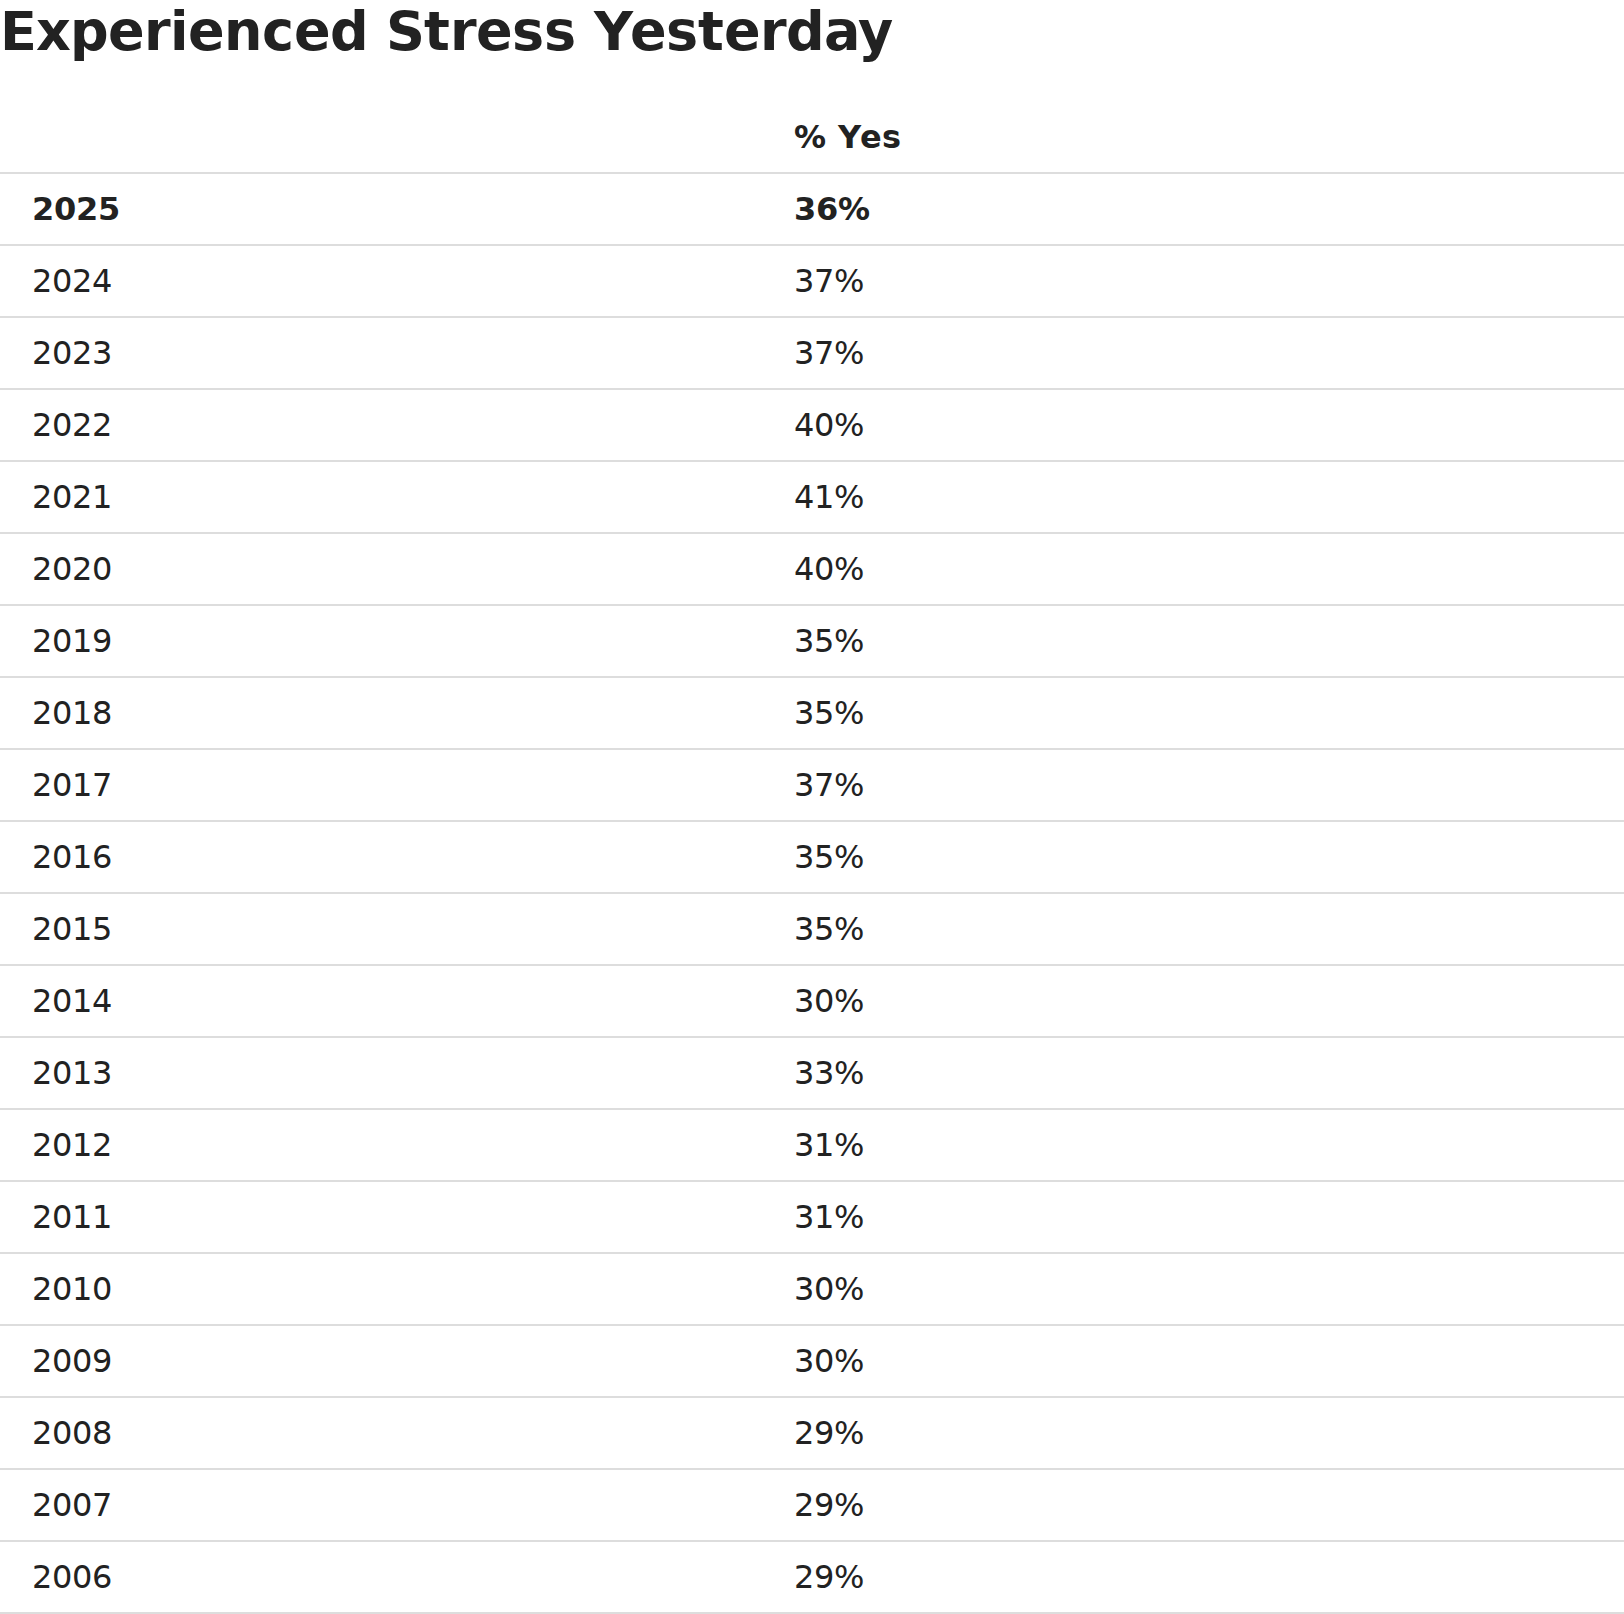
- Globally, 36% of adults age 15+ reported stress during a lot of the previous day in 2025. (Gallup, November 2026)
- Globally, 54% of adults age 15+ reported learning or doing something interesting the previous day in 2025. (Gallup, November 2026)
- 88% of U.S. adults age 40+ rated maintaining brain health as very important in the December 2025–January 2026 survey. (Alzheimer’s Association, April 2026)
- In that same brain-health survey, 9% said they knew a lot about maintaining it. (Alzheimer’s Association, April 2026)
- In Zepbound Study 1, without type 2 diabetes, 88.9% of the 10-mg trial arm achieved at least five-percent weight loss at the 72-week endpoint. (Eli Lilly, August 2026)
- In pooled Zepbound Studies 1 and 2, severe gastrointestinal reactions occurred in 3.1% of participants in the 15-mg trial arm. (Eli Lilly, August 2026)
What do national statistics show about weight management?
Weight statistics need context before they can inform a personal goal. These national estimates describe measured body-size categories, not someone’s habits, fitness, worth or likely response to coaching.
How common are the measured weight categories?
The latest reporting window below is the period when measurements were collected, even though the report was published later. All estimates in this section use the same age-adjustment approach so differences in population age structure do not dominate comparisons. Overweight excludes obesity in this table. Severe obesity sits inside the obesity category, so adding all the percentages would double-count people. These are population categories used for surveillance, not a complete assessment of any individual. If you are setting a personal goal, consider what information would help you discuss it with a qualified professional. A national prevalence estimate cannot establish the right weight, eating pattern or treatment for a particular person.
Scope: U.S. adults age 20+; age-adjusted measured prevalence, August 2021–August 2023.
| Measure | Result | Primary source |
|---|---|---|
| All adults: severe obesity | 9.7% | (CDC/NCHS, February 2026) |
How do the estimates differ by sex?
The sex-specific rows use the categories reported by the source. They are not explanations of why the estimates differ, and they do not show that one group has better habits. The survey cannot tell a reader how much any one person walks, lifts, sleeps or eats from their weight category alone. Use these figures as context for the scale of weight-management questions across the population. For a personal conversation, goals and constraints need to be understood directly. Good Vita’s program overview describes its educational approach; clinical assessment and treatment decisions belong with an appropriately licensed health professional.
Scope: Same population and period; source-reported sex groups.
| Measure | Result | Primary source |
|---|---|---|
| Men: overweight, excluding obesity | 35.5% | (CDC/NCHS, February 2026) |
| Men: obesity | 39.3% | (CDC/NCHS, February 2026) |
| Men: severe obesity | 6.8% | (CDC/NCHS, February 2026) |
| Women: overweight, excluding obesity | 28.1% | (CDC/NCHS, February 2026) |
| Women: obesity | 41.4% | (CDC/NCHS, February 2026) |
| Women: severe obesity | 12.6% | (CDC/NCHS, February 2026) |
What does the historical comparison establish?
A historical estimate gives the current figure a reference point. It does not, by itself, establish a statistically significant change or explain what caused one. Before describing a trend, check the survey design, measurement methods, age adjustment and uncertainty around each estimate. Different reporting windows also should not be presented as annual measurements. For a reader evaluating a wellness claim, this is a useful habit: ask whether the comparison uses the same population, definition and method. An impressive-looking difference may answer a narrower question than the headline suggests. This article retains the earlier observation as historical context without treating the pair as proof of improvement or decline.
Scope: Same age-adjusted national measure; historical reporting period labeled in the row.
| Measure | Result | Primary source |
|---|---|---|
| All adults: obesity in 2017–2018 | 42.4% | (CDC/NCHS, February 2026) |
What are people looking for in their eating habits?
A useful eating plan must connect with the person’s priorities. Consumer research can show what people want and what they say they do; it cannot tell you which diet produced a health benefit.
Which eating patterns do people report?
These responses describe reported eating patterns and an intention to consume a nutrient. They do not measure adherence, nutrient adequacy or health outcomes. Someone may select several patterns, and the labels need not describe mutually exclusive ways of eating. The general diet question and the protein question are also different questions, so their percentages should not be combined. When discussing your own routine, a useful starting point is what you actually eat and what changes you can sustain. The survey is a reference for consumer interests, not a menu or a recommendation to adopt the most popular approach. Its U.S. results are kept separate from the report’s Canadian sample.
Scope: U.S. survey respondents ages 18–80, 2026; past-year diet responses may overlap. Protein intent comes from a separate question.
| Measure | Result | Primary source |
|---|---|---|
| High-protein pattern | 27% | (International Food Information Council, October 2026) |
| Low-sugar/sugar-free pattern | 22% | (International Food Information Council, October 2026) |
| Mindful eating | 21% | (International Food Information Council, October 2026) |
| Clean eating | 17% | (International Food Information Council, October 2026) |
| Calorie counting | 16% | (International Food Information Council, October 2026) |
| Intermittent fasting | 15% | (International Food Information Council, October 2026) |
How do consumers define a healthy food?
The rows below describe the characteristics respondents associated with a healthy food. They are perceptions, not a scoring system that determines whether a meal meets a person’s needs. Respondents could select several characteristics. A word on a label may attract attention while leaving important questions unanswered about the product or the overall eating pattern. When evaluating a food claim, ask what the term means in that context and what evidence supports the implied benefit. This is different from assuming that a familiar or appealing descriptor proves nutritional value. The survey helps explain how consumers interpret food; it does not validate each interpretation as a clinical rule.
Scope: U.S. survey, 2026; characteristics chosen to define a healthy food, up to five choices.
| Measure | Result | Primary source |
|---|---|---|
| Fresh | 40% | (International Food Information Council, October 2026) |
| Good source of protein | 33% | (International Food Information Council, October 2026) |
| Good source of nutrients | 31% | (International Food Information Council, October 2026) |
| Low in sugar | 29% | (International Food Information Council, October 2026) |
| Natural | 28% | (International Food Information Council, October 2026) |
Which benefits are people seeking from food?
The distinction between a benefit sought and a benefit achieved matters throughout wellness content. Selecting energy, sleep or healthy aging as a goal does not show that the respondent’s food choices produced that result. Several goals can matter to the same person, so these responses overlap. For a personal plan, first define the practical change you want to work on, then decide how to notice whether it is helping. The research can help frame that conversation without supplying an outcome guarantee. These figures concern goals attached to foods, beverages or nutrients; they do not measure supplement effectiveness or establish that any product treats a condition.
Scope: U.S. survey, 2026; benefits sought from foods, beverages or nutrients, not achieved outcomes.
| Measure | Result | Primary source |
|---|---|---|
| Healthy aging | 39% | (International Food Information Council, October 2026) |
| Weight loss/management | 37% | (International Food Information Council, October 2026) |
| Energy/less fatigue | 36% | (International Food Information Council, October 2026) |
| Digestive/gut health | 35% | (International Food Information Council, October 2026) |
| Muscle health/strength/endurance | 30% | (International Food Information Council, October 2026) |
| Improved sleep | 29% | (International Food Information Council, October 2026) |
| Heart/cardiovascular health | 29% | (International Food Information Council, October 2026) |
How many adults meet aerobic activity guidelines?
Start by naming the activity being measured. These estimates concern aerobic activity during leisure time, which is only one part of a conversation about movement and strength.
How does aerobic activity differ by age and sex?
The population here differs from the measured-weight survey above: this section covers adults starting at a younger age and uses reported activity. The measure concerns meeting federal aerobic recommendations in leisure time, rather than all movement across a day. It therefore should not be labeled total activity or overall fitness. The age and sex comparisons describe groups, while the underlying circumstances of individuals can vary considerably. If you are deciding where to begin, identify the activity you want to make more consistent and the practical barriers you face. National estimates can place that discussion in context, but they cannot establish your capacity or the right progression for you.
Scope: U.S. adults age 18+, 2024; meeting aerobic guidelines during leisure time.
| Measure | Result | Primary source |
|---|---|---|
| Men | 52.3% | (CDC/NCHS, April 2026) |
| Women | 42.4% | (CDC/NCHS, April 2026) |
| Ages 18–34 | 54.0% | (CDC/NCHS, April 2026) |
| Ages 35–49 | 49.8% | (CDC/NCHS, April 2026) |
| Ages 50–64 | 44.6% | (CDC/NCHS, April 2026) |
How do activity estimates vary by education?
Education groups are useful for describing the survey distribution, not for judging effort or assigning a cause to a difference. The figures do not isolate access, time, income, health or other circumstances. A reader should avoid turning a group association into a claim about why a particular person is active. These rows also use the same leisure-time definition as the rest of this section. For a personal routine, the planning questions remain concrete: what can fit into the week, what feels manageable, and what support is needed? The data do not test a coaching intervention or estimate the improvement someone should expect from joining a program.
Scope: Same aerobic measure, population and year; education groups.
| Measure | Result | Primary source |
|---|---|---|
| Less than high school diploma/GED | 32.3% | (CDC/NCHS, April 2026) |
| High school diploma/GED | 38.6% | (CDC/NCHS, April 2026) |
| Some college/associate degree | 47.4% | (CDC/NCHS, April 2026) |
| Bachelor’s degree or higher | 58.5% | (CDC/NCHS, April 2026) |
Does aerobic activity measure strength or overall fitness?
The final observation comes from a separate disability-status comparison in the same report. It is included with its base attached rather than blended with the age or education results. Disability status does not describe every individual’s needs or capabilities, and the statistic should not be used to set expectations for someone else. Likewise, meeting an aerobic measure does not establish adherence to muscle-strengthening guidance, recovery quality or a fitness outcome. Keep those questions separate when reading a wellness dashboard. A plan can include more than one kind of activity, but this source supports claims only about the aerobic measure that it actually collected.
Scope: Same aerobic measure and year; disability-status subgroup.
| Measure | Result | Primary source |
|---|---|---|
| Without disabilities | 49.8% | (CDC/NCHS, April 2026) |
What do sleep and recovery statistics actually measure?
Recovery deserves more than a single sleep-duration number. This survey distinguishes how long adults sleep, whether they feel rested and whether they have difficulty falling asleep.
How common is short sleep?
Short sleep is defined here by average duration across a full day. The measure is not the same as a diagnosed sleep disorder or a direct measurement from a wearable. The age and sex rows describe the same survey question, which makes them useful for understanding its distribution. They do not establish the reasons for short sleep in any group. Work schedules, caregiving and other personal circumstances require direct discussion rather than inference from a national table. When quoting a figure, retain the definition and the reporting year. The findings describe the survey period, not a live measurement of how adults are sleeping this month.
Scope: U.S. adults age 18+, 2024; average sleep below seven hours per 24-hour period.
| Measure | Result | Primary source |
|---|---|---|
| Men | 30.6% | (CDC/NCHS, April 2026) |
| Women | 30.4% | (CDC/NCHS, April 2026) |
| Ages 18–34 | 27.2% | (CDC/NCHS, April 2026) |
| Ages 35–49 | 33.4% | (CDC/NCHS, April 2026) |
| Ages 50–64 | 34.5% | (CDC/NCHS, April 2026) |
| Ages 65+ | 27.2% | (CDC/NCHS, April 2026) |
How often do adults wake up well-rested?
Feeling rested is a separate question from how long someone sleeps. The results below therefore should not be treated as the complement of the short-sleep figures. People can answer the two questions in different ways, and the report does not turn them into a single recovery score. The useful reading habit is to check the wording before comparing percentages. For your own reflection, you might notice duration and how you feel on waking as different observations. Neither a national percentage nor an informal personal observation establishes a diagnosis. Good Vita’s frequently asked questions explains the boundary between wellness education and medical care.
Scope: Same population/year; waking well-rested most days or every day.
What does difficulty falling asleep add?
Trouble falling asleep adds another dimension to the description. The frequency threshold matters: this measure does not mean that everyone who ever struggles to fall asleep is counted. It also does not represent all sleep difficulties, since other problems can occur after someone has fallen asleep. These rows should not be added to short sleep or lack of rest to estimate a combined population. The people in those categories may overlap. If a sleep issue is affecting you, a qualified clinician can evaluate the individual situation. This table supplies population context; it does not identify a cause or select a treatment, peptide or supplement.
Scope: Same population/year; trouble falling asleep most days or every day.
| Measure | Result | Primary source |
|---|---|---|
| All adults | 15.4% | (CDC/NCHS, April 2026) |
| Women | 18.5% | (CDC/NCHS, April 2026) |
How common are stress and positive everyday experiences?
Everyday wellbeing includes difficult and positive experiences. The figures below come from a global poll, so they supply a wider perspective rather than an estimate for Good Vita clients or Colorado residents.
Which difficult experiences do people report?
Gallup asked about experiences on the preceding day. The negative items refer to experiencing each feeling or sensation during a lot of that day. This is a different type of evidence from a clinical prevalence study, and it spans countries with very different circumstances. The responses can overlap, so they do not divide the population into separate categories. Keep the global geography and the younger adult age threshold attached when quoting them. These figures help describe lived experience at a broad level. They do not establish a diagnosis, measure burnout in a particular workplace or demonstrate that a wellness service reduces stress.
Scope: Adults age 15+ globally, 2025; experienced a lot of the previous day.
| Measure | Result | Primary source |
|---|---|---|
| Worry | 38% | (Gallup, November 2026) |
| Physical pain | 33% | (Gallup, November 2026) |
| Sadness | 26% | (Gallup, November 2026) |
| Anger | 23% | (Gallup, November 2026) |
Which positive experiences do people report?
Positive experiences do not cancel difficult ones, and the same person can report both. The individual items also have different wording: respect concerns the whole day, while other items concern a particular experience or feeling. They should not be merged into a personal wellbeing grade. The global findings offer prompts for reflection, such as whether a routine leaves room for connection, curiosity or rest. Those are planning questions, not effects tested by this poll. The live indicator’s access month is identified in the citations because it does not display a publication date for each item. Its data year remains separate and is stated explicitly.
Scope: Same global population/year; previous-day experiences, with item wording retained.
| Measure | Result | Primary source |
|---|---|---|
| Enjoyment | 70% | (Gallup, November 2026) |
| Felt well-rested | 71% | (Gallup, November 2026) |
| Smiled/laughed a lot | 72% | (Gallup, November 2026) |
| Treated with respect all day | 83% | (Gallup, November 2026) |
What do adults want from healthy aging and brain-health support?
Healthy aging is a practical planning question as well as a research topic. This national survey looks specifically at brain-health beliefs, reported habits and program preferences among adults in midlife and beyond.
How do adults view their brain health?
This section concerns brain health rather than every aspect of aging. The original research asked a national sample of adults in midlife and older age about their understanding and preferences. A strong belief that something matters is different from detailed knowledge about it. Likewise, respondents’ beliefs about lifestyle do not demonstrate that a particular habit prevents dementia. Keep that distinction visible when using the results in an article or conversation. The survey can help identify questions people want answered, while claims about prevention or treatment require a different kind of evidence. These findings should not be interpreted as a cognitive assessment of respondents or of the reader.
Scope: U.S. adults age 40+; survey December 2025–January 2026; beliefs and knowledge.
| Measure | Result | Primary source |
|---|---|---|
| Lifestyle behaviors are very important for maintaining brain health | 75% | (Alzheimer’s Association, April 2026) |
| Associate good brain health with clear thinking for sound decisions | 82% | (Alzheimer’s Association, April 2026) |
Which habits are part of everyday life?
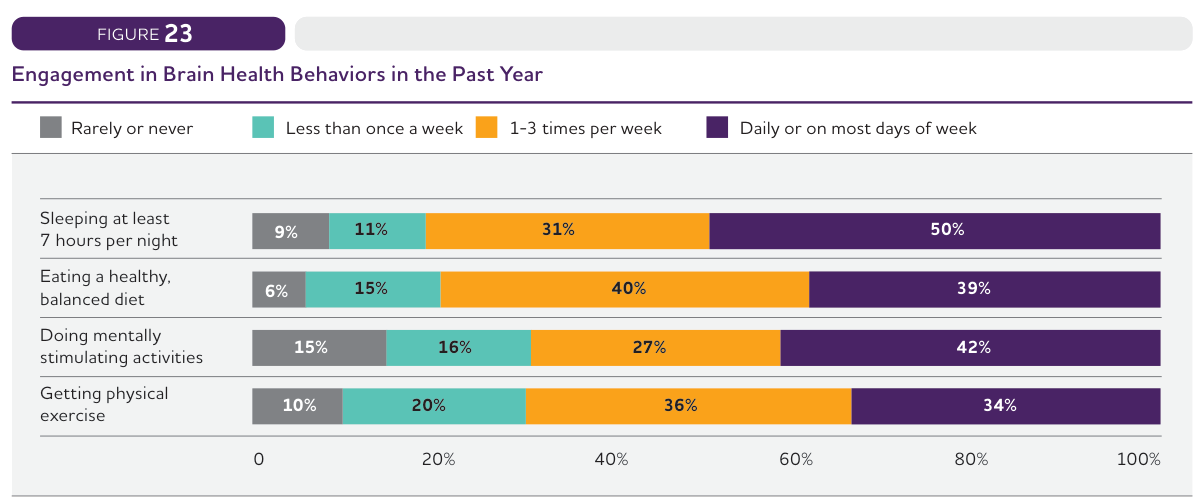
The habit-frequency rows use the survey’s wording and refer to the past year. They distinguish activities reported on most days from activities reported only on some days of a week. They do not measure the quality of a diet, the intensity of exercise or a clinical cognitive outcome. Someone’s answer to one habit question also does not reveal their answers to the others. For an everyday plan, it can be useful to discuss one routine in enough detail to understand what is actually happening. The table supports that distinction between intentions and frequency without implying that a specific frequency is a proven prevention prescription.
Scope: Same national survey; past-year reported frequency.
| Measure | Result | Primary source |
|---|---|---|
| Sleep at least seven hours: daily/most days | 50% | (Alzheimer’s Association, April 2026) |
| Healthy balanced diet: daily/most days | 39% | (Alzheimer’s Association, April 2026) |
| Mentally stimulating activities: daily/most days | 42% | (Alzheimer’s Association, April 2026) |
| Physical exercise: daily/most days | 34% | (Alzheimer’s Association, April 2026) |
| Sleep at least seven hours: one–three times weekly | 31% | (Alzheimer’s Association, April 2026) |
| Healthy balanced diet: one–three times weekly | 40% | (Alzheimer’s Association, April 2026) |
| Mentally stimulating activities: one–three times weekly | 27% | (Alzheimer’s Association, April 2026) |
| Physical exercise: one–three times weekly | 36% | (Alzheimer’s Association, April 2026) |
What would make a brain-health program practical?
Interest in a hypothetical program is not enrollment, and a preferred format is not proof that it produces better outcomes. The practical factors below concern decisions about participation, with overlapping responses where the survey allowed them. They can help frame service design questions: can someone understand the time commitment, location, cost and way the program works? Those details should be explained clearly before a person commits. This article does not claim that Good Vita provides the intervention described in the research or reproduces its results. The survey is included to show what respondents considered practical, alongside their preferences for self-guided and in-person support.
Scope: Same national survey; program interest, format preferences and participation factors.
| Measure | Result | Primary source |
|---|---|---|
| Interested in a brain-health program | 73% | (Alzheimer’s Association, April 2026) |
| Prefer fully self-guided at home | 40% | (Alzheimer’s Association, April 2026) |
| Prefer hybrid in-person/self-guided | 39% | (Alzheimer’s Association, April 2026) |
| Prefer fully in-person | 8% | (Alzheimer’s Association, April 2026) |
| Cost is very important for participation | 73% | (Alzheimer’s Association, April 2026) |
| Location is very important | 67% | (Alzheimer’s Association, April 2026) |
| Personal motivation is very important | 59% | (Alzheimer’s Association, April 2026) |
| Insurance coverage is very important | 58% | (Alzheimer’s Association, April 2026) |
What does clinical research show about peptides?
Peptide claims should be evaluated compound by compound. This section focuses on incretin-based medicines studied for weight management, rather than every peptide. The evidence here separates an FDA-approved prescription medicine from an investigational medicine, and places treatment outcomes alongside adverse-event information.
What happened in the Zepbound trial without type 2 diabetes?
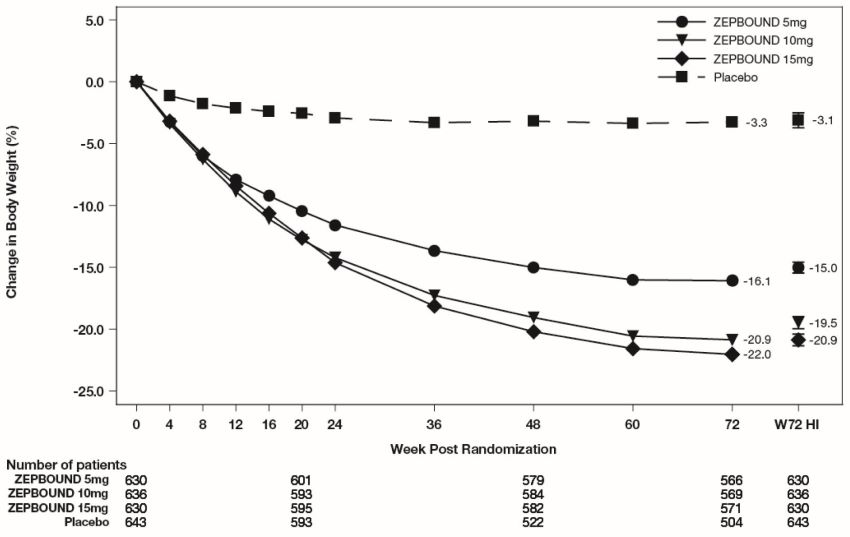
Zepbound is the branded tirzepatide medicine described in the prescribing information. Study 1 enrolled adults with obesity or overweight under the study’s eligibility criteria, without type 2 diabetes. Every group received a reduced-calorie diet and increased-activity intervention, including placebo. The rows below use the label’s adjusted endpoints with missing-data imputation. A negative percentage indicates a reduction in body weight from baseline. Arm amounts identify randomized research groups; they are not instructions for selecting, starting or changing treatment. The figure also shows observed trajectories, whose values differ from imputed endpoints. These are medicine-trial results, not outcomes of Good Vita coaching or a promise of an individual response.
Scope: Study 1, 72-week endpoints, without type 2 diabetes; all arms received diet/activity intervention.
| Measure | Result | Primary source |
|---|---|---|
| Placebo: mean body-weight change | −3.1% | (Eli Lilly, August 2026) |
| Zepbound 5-mg trial arm: mean change | −15.0% | (Eli Lilly, August 2026) |
| Zepbound 10-mg trial arm: mean change | −19.5% | (Eli Lilly, August 2026) |
| Zepbound 15-mg trial arm: mean change | −20.9% | (Eli Lilly, August 2026) |
| Placebo: achieved at least 5% weight loss | 34.5% | (Eli Lilly, August 2026) |
| Zepbound 15-mg arm: achieved at least 5% loss | 90.9% | (Eli Lilly, August 2026) |
Why keep the diabetes trial separate?
Study 2 included adults with type 2 diabetes, so its results remain in a separate table. The populations should not be combined into a single expected weight-loss percentage. The shared follow-up length does not remove differences in eligibility and baseline characteristics. Treatment comparisons are most informative within the randomized study that produced them. If you are evaluating a headline, ask which population, endpoint and analysis it describes before comparing it with another result. Good Vita offers peptide education; it does not prescribe medicines or determine eligibility. Clinical decisions require a licensed professional who can consider the full prescribing information and the person’s circumstances.
Scope: Study 2, 72-week endpoints, with type 2 diabetes; all arms received diet/activity intervention.
| Measure | Result | Primary source |
|---|---|---|
| Placebo: mean body-weight change | −3.2% | (Eli Lilly, August 2026) |
| Zepbound 10-mg trial arm: mean change | −12.8% | (Eli Lilly, August 2026) |
| Zepbound 15-mg trial arm: mean change | −14.7% | (Eli Lilly, August 2026) |
What do adverse events and investigational research add?
The gastrointestinal figures below are severe reactions pooled across the label’s two studies, not the overall frequency of adverse events. The full label includes other risks and a boxed warning concerning thyroid C-cell tumors; the relevance of rodent findings to humans is unknown. The investigational retatrutide rows come from a different, longer trial and cannot establish superiority over Zepbound. TRIUMPH-1 was funded by Lilly. FDA states that retatrutide is not a component of an approved drug and cannot be used in compounding. No result here validates other peptides or supports a dosing, sourcing or treatment recommendation. Research status and study limitations matter as much as the headline result.
Scope: Each row identifies either pooled Zepbound safety data or the separate 80-week investigational TRIUMPH-1 trial.
| Measure | Result | Primary source |
|---|---|---|
| Pooled Studies 1–2: Placebo: severe gastrointestinal reactions | 1.0% | (Eli Lilly, August 2026) |
| Pooled Studies 1–2: Zepbound 5-mg arm: severe gastrointestinal reactions | 1.7% | (Eli Lilly, August 2026) |
| Pooled Studies 1–2: Zepbound 10-mg arm: severe gastrointestinal reactions | 2.5% | (Eli Lilly, August 2026) |
| TRIUMPH-1, 80 weeks: Investigational retatrutide 12-mg arm: mean body-weight change | −25.0% | (TRIUMPH-1 investigators, September 2026) |
| TRIUMPH-1, 80 weeks: TRIUMPH-1 placebo: mean body-weight change | −3.9% | (TRIUMPH-1 investigators, September 2026) |
Methodology and Sources
This reference contains 100 distinct, individually cited observations. Fourteen appear in Key Takeaways and the other observations appear once in the tables. Figures visualize source material and can include additional contextual rows; chart labels, study-arm identifiers and methodological details are not counted as additional article statistics. Only original survey producers, government data, manufacturer prescribing information and an original clinical study were used. The largest producer contribution is CDC/NCHS; reports from the same producer are grouped together in the inventory. Publication months are distinguished from collection periods. Gallup’s undated live indicator uses the access month explicitly, with the data year stated separately. The planned editorial cadence is monthly: recheck links, updated releases, study status and scope before changing the article.
Clinical-trial findings retain the medicine, population, endpoint and follow-up period. Safety data use their own stated base. Cross-trial comparisons are not head-to-head evidence. Consumer preferences and reported habits are not clinical outcomes, and none of these sources measures the effect of Good Vita’s services. The accompanying inventory records the locator, scope and limitations for every observation.
Sources
- CDC/NCHS: Prevalence of overweight, obesity, and severe obesity among adults — February 2026; data: August 2021–August 2023; historical comparison 2017–2018.
- International Food Information Council: 2026 Food & Health Survey: A Focus on Food & Nutrition — October 2026; data: March 22–April 8, 2026.
- CDC/NCHS: Aerobic Physical Activity Among Adults: United States, 2024 — April 2026; data: 2024.
- CDC/NCHS: Sleep Characteristics of Adults: United States, 2024 — April 2026; data: 2024.
- Gallup: Global Indicator: Emotional Wellbeing — November 2026; data: 2025.
- Alzheimer’s Association: Brain Health in America: Understanding and Supporting Lifelong Cognitive Health — April 2026; data: December 29, 2025–January 13, 2026.
- Eli Lilly: Zepbound U.S. prescribing information, hosted by DailyMed — August 2026; data: 72-week randomized trials, Studies 1 and 2.
- TRIUMPH-1 investigators: Retatrutide for the Treatment of Obesity — September 2026; data: 80-week randomized phase 3 trial.
- FDA: Concerns with unapproved GLP-1 drugs used for weight loss — regulatory context checked November 4, 2026.